Analytic Information
Business Segments - Key Figures
| Local Infrastructure |
Central Infrastructure | Security |
Other |
|||||
| Amounts in NOK million | 2012 | 2011 | 2012 | 2011 | 2012 | 2011 | 2012 | 2011 |
| Profitability | ||||||||
| Operating revenues | 1 894 | 1 989 | 591 | 611 | 321 | 306 | 22 | 13 |
| Purchased materials | (905) | (959) | (282) | (281) | (97) | (93) | (2) | - |
| Salaries and other personnel exps. | (615) | (679) | (235) | (229) | (138) | (132) | (40) | (20) |
| Other operating exps. | (247) | (239) | (67) | (82) | (58) | (56) | 5 | (6) |
| Operating profit before depreciation | 128 | 112 | 8 | 19 | 29 | 27 | (16) | (13) |
| Operating profit | 103 | 86 | 3 | 12 | 26 | 23 | (24) | (20) |
| Operating margin | 5.5% | 4.3% | 0.4% | 2.0% | 8.1% | 7.6% | -112.5% | -156.7% |
| Additional key figures | ||||||||
| Operating investments | 26 | 31 | 6 | 5 | 1 | 1 | 6 | 8 |
| Capital employed | 297 | 209 | 117 | 92 | 132 | 113 | (84) | (216) |
| Number of employees (as of 31 dec.) | 1 054 | 1 120 | 391 | 366 | 206 | 202 | 21 | 17 |
| Number of man-years (as of 31 dec.) | 1 047 | 1 115 | 388 | 360 | 205 | 201 | 20 | 16 |
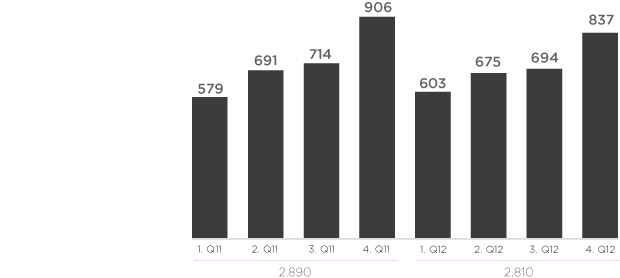
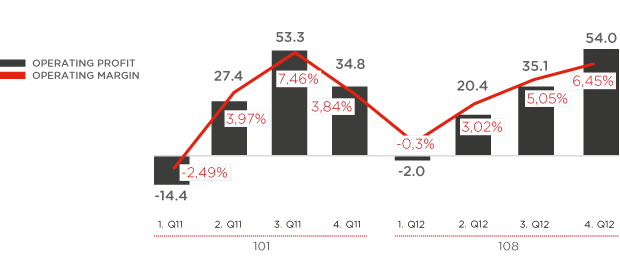
Quarterly development of operating revenues and operating profit
Seasonal variations characterize the Group's operations with an increased activity level and margin level towards the second half of the year.
Revenues per quarter
Amounts in NOK million
Business Segments - Key Figures
Amounts in NOK million
Key figures Group
| Amounts in NOK million | Definition | 2012 | 2011 |
 |
|||
| Profitability | |||
| Operating revenues | 2 810 | 2 890 | |
| Operating profit before depreciation | 149 | 144 | |
| Operating profit | 108 | 101 | |
| Operating profit before tax | 101 | 100 | |
| Profit, discontinued operations | 1 | - | (4) |
| Profit for the year | 71 | 71 | |
| Operating margin, incl. gain on sale of alarm portfolio | 2 | 3.8% | 3.5% |
| Cash Flow | |||
| Net cash flow from operations | 3 | 98 | 177 |
| Operating investments | (39) | (45) | |
| Capital matters as of 31 December | |||
| Totalt assets | 1 480 | 1 648 | |
| Capital employed | 4 | 462 | 769 |
| Equity | 697 | 484 | |
| Equity ratio (%) | 5 | 47% | 29% |
| Net interest bearing debt (cash and cash equivalents) | 6 | (234) | (285) |
| HSE key figures | |||
| Number of employees | 1 672 | 1 705 | |
| Number of man-years | 1 659 | 1 693 | |
| Sick leave | 4.6% | 4.9% | |
| Share related key figures | |||
| Number of shares as of 31 December | 63 863 224 | 63 863 224 | |
| Average number of shares | 63 863 224 | 63 863 224 | |
| Own (treasury) shares | - | - | |
| Share price as of 31 December (NOK) | 7 | 18.6 | 20.6 |
| Market capitalization as of 31 December (NOK million) | 1 188 | 1 316 | |
| Profit per share (NOK) | 8 | 1.1 | 1.1 |
| Cash flow from operations per share (NOK) | 9 | 1.5 | 2.8 |
| Dividend per share (NOK) | 10 | 1.50 | 1.50 |
| Dividend payout ratio | 11 | 135% | 134% |
Definitions
| 1) |
Infratek sold Østlandske Elektro ASA on 30 November 2011.
|
| 2) | Operating margin = Operating profit / Operating revenues |
| 3) | Net cash flow from operations = as defined in the Group cash flow statement |
| 4) | Capital employed = Equity + Net nominal interest bearing debt (cash and cash equivalents) |
| 5) |
Equity ratio = Equity / Total assets
|
| 6) |
Net interest bearing debt (cash and cash equivalent) = Book value of interest bearing liabilities - cash and cash equivalents
|
| 7) |
Share price at the year-end 2012 is based on the latest trade share price in 2012
|
| 8) | Profit per share = Profit for the year / Average number of shares |
| 9) | Cash flow from operations per share = Net cash flow from operations / Average number of shares |
| 10) | Dividend per share = The proposed dividend by the Board of Directos for the accounting year 2012 and actual paid dividend for 2011. |
| 11) | Dividend ratio = The Board of Directors proposed dividend / Profit for the year |


